The MAIN JOURNAL for POWER GRID SPECIALISTS in RUSSIA
6
po
we
r
su
pp
ly
power supply
Аnalysis of Domestic
and Foreign Experience
in Rationing the
Reliability of Power
Distribution Networks
The paper analyzes domestic and foreign experience and
compares the different countries approaches to rationing the
power distribution networks reliability. The main indicators
of power supply reliability in different countries with respect
to outages, approaches for planned values determination and
clustering of networks with similar characteristics are con-
sidered. Understanding the basic principles of power distribu-
tion network reliability regulation applied in foreign countries
allows specialists to identify best practices and adapt them
to domestic conditions.
Dmitry Gvozdev,
First Deputy General Director –
Chief Engineer, PJSC Rosseti
Moscow Region
Dmitry Gabdushev,
Leading specialist of the Power
System Modes Department,
PJSC Rosseti Moscow
Region
Rostislav Goenko,
Senior Laboratory Assistant of
the Department of Theoretical
Foundations of Electrical
Engineering, National
Research University “Moscow
Power Engineering Institute”
Daria Klimkina,
Assistant of the Department
of Theoretical Foundations
of Electrical Engineering,
National Research University
“Moscow Power Engineering
Institute”
Dmitry Buyankov,
Chief
Expert of the Power System
Modes Department, PJSC
Rosseti Moscow Region
Artem Vanin,
Associate
Professor of the Department
of Theoretical Foundations
of Electrical Engineering,
National Research University
“Moscow Power Engineering
Institute”, Ph.D.
D
istribution networks carry out the
transmission of electric power from
large power centers (35-220 kV
substations or power plants) to
a large number of consumers. Ultimate con-
sumers have small load power and are dis-
tributed over a large area. In this regard,
power distribution networks have a complex
multidivisional structure and a hierarchical
design concept.
Regulatory authorities in diff erent coun-
tries apply their own approaches to stan-
dardizing reliability and develop their own pri-
orities. Approaches for regulating distribution
network reliability, investigated in this paper,
include a comparison between jurisdictions
in Russia, the UK, Italy, the Netherlands and
the USA (California and New York states).
The analysis carried out in this article is
useful in developing the regulatory frame-
work. The results of the comparative analysis
can be used in the development of new regu-
latory documents. It will create more eff ective
rules and standards for regulating the reliabil-
ity of distribution networks in Russia.
When analyzing the experience of reliabil-
ity standardization, comparison was carried
out according to the following criteria:
– power supply reliability indicators;
– accountable outages;
– determination of reliability indicators
planned values;
– clustering networks with similar charac-
teristics.

EP Shanghai 2023
Special issue, November 2023
7
POWER SUPPLY
RELIABILITY INDICATORS
Reliability of power supply is characterized by the
interruptions in power supply to consumers, its
frequency and duration. A large number of diff erent
indicators can be used to represent them numerically.
A complete list of indicators is given in the IEEE Std
1366-2012 standard [1]. The most commonly used
indicators are, as follows:
– SAIFI
(System Average Interruption Frequency In -
dex)
– an indicator of the average frequency of long-
term interruptions in the electric power transmission
to the delivery point or per consumer. It is defi ned as
the ratio of all long-term power supply interruptions
during the billing period to the number of supply
points or consumers:
SAIFI =
N
i
/
N
T
.
(1)
– SAIDI
(System Average Interruption Duration In
-
dex)
– an indicator of the interruption average
duration in the electric power transmission to the
delivery point or per consumer. It is defi ned as
the ratio of duration of all long-term power supply
disruptions during the billing period to the number
of supply points or consumers:
SAIDI =
r
i
N
i
/
N
T
.
(2)
– CAIDI
(Customer Average Interruption Duration
Index)
– an indicator of the average duration
of power supply restoration. It is defi ned as the
ratio of total duration of all long-term power
supply disruptions to all long-term power supply
disruptions for the billing period. Also equal to the
ratio of SAIDI to SAIFI:
СAIDI =
r
i
N
i
/
N
i
= SAIDI / SAIFI.
(3)
– MAIFI
(Momentary Average Interruption Fre-
quen cy Index)
– an indicator of the average
frequency of short-term interruptions in the
electric power transmission to the delivery point
or per consumer. It is defined as the ratio of all
short-term power supply interruptions during the
billing period to the number of supply points or
consumers:
MAIFI =
IM
i
N
mi
/
N
T
.
(4)
The following notations are used in the given for-
mulas (1)-(4):
N
i
– number of disconnected consum-
ers during the
i
-th technological disruption;
r
i
– dura-
tion of power supply disruption to consumers during
the
i
-th technological disruption;
N
T
– the total num-
ber of consumers or delivery points in the network,
reliability indicators are determined for;
IM
i
– number
of short-term power outages;
N
mi
– number of discon-
nected consumers during the
i
-th short-term power
outage.
IEEE Std 1366-2012 [1] classifi es power outages as
short-term if they last less than 5 minutes and as long-
term if they last for more than 5 minutes. The minimum
duration of a long-term power supply interruption,
established by regulations, may diff er in diff erent
countries.
The RUSSIAN FEDERATION
Power supply reliability indicators
The indicator of the average interruption fre-
quency while electric power transmission to the
SAIFI
delivery point and the indicator of the average
interruption duration while electric power transmis-
sion to the
SAIDI
delivery point, analogues SAIFI
and SAIDI, are used in Russia for reliability indica-
tors standardization.
Accountable outages
In accordance with the guidelines for calculating
the reliability level [2], interruptions in the transmis-
sion of electric power to consumers as a result of
technological violations at the facilities of the grid
operator are considered to calculate reliability in-
dicators. These outages must last longer than the
automatic power restoration time. The exception is
when the grid operator is not responsible for power
outages.
Planned outages are not taken into account in
the main reliability indicators. The termination of
power transmission to consumers during repair
work is characterized separately by
SAIDI,rep
,
SAIFI,rep
indicative parameters.
Determination
of reliability indicators planned values
When planning tariffs, long-term regulatory
para meters are established. These parameters for
calculating long-term prices (tariffs) are established
for a long-term regulatory period.
Long-term regulation period is a period of at
least 5 years. Long-term regulation parameters
are calculated for this period. The long-term reg-
ulation period is divided into regulation periods of
12 months [3].
When forming planned values of reliability in-
dica tors for territorial grid organizations, the meth-
od of com paring analogues is used. This method
is based on comparing the performance indicators
of territorial network organizations that have com-
parable economic and (or) technical characteristics
and (or) operating conditions [2].
For the first year in the long-term regulation pe-
riod, the planned values of the
pl
t
,SAIDI
and
pl
t
,SAIFI
indi-
cators are determined based on:
– the minimum value of the reliability indicators
actual value for the previous year and actual
average values of the reliability indicators for the
three previous years;
– a one-time improvement of the reliability indicators
minimum value using the reliability indicators
im prove ment rate.
For the second and subsequent calculation periods
of the long-term regulation period, the planned values
of reliability level indicators are determined using the
following formulas:
pl
t
,+1,SAIDI
=
pl
t
,SAIDI
· (1 –
r
m
,SAIDI
),
(5)
pl
t
,+1,SAIFI
=
pl
t
,SAIFI
· (1 –
r
m
,SAIFI
),
(6)

8
where
pl
t
,SAIDI
,
pl
t
,SAIFI
– the planned values estab-
lished by the regulatory body for the reliability level
indicator for the estimated regulation period (
t
) for
territorial grid organizations (TGO);
r
m
,SAIDI
,
r
m
,SAIFI
–
improvement rate of the reliability level indicator for
the network organization of group
m
;
m
– TGO group
number for this reliability indicator. It is important to
note that the TGO clustering by
pl
t
,SAIDI
and
pl
t
,SAIFI
in-
dicators varies.
The procedure for calculating the planned values
of indicators is given in Order No. 1256 of the Ministry
of Energy of the Russian Federation dated November
29, 2016 [2].
Clustering networks with similar
characteristics
Basic values of reliability indicators are estab-
lished for TGO groups that have characteristics and
(or) operating conditions comparable to each other
based on the method of comparing analogues. Vari-
ous clusterings are used for
pl
t
,SAIDI
and
pl
t
,SAIFI
indi-
cators. TGO clustering signs and basic values of
reliability indicators for groups are given in Order of
the Ministry of Energy of the Russian Federation No.
976 dated October 18, 2017 [4]. The main clustering
criteria are as follows: length of power transmission
lines, cable lines proportion, number of switching de-
vices, average summer temperature (more than 20°C
/ less than 20°C), load density, number of transmis-
sion points.
GREAT BRITAIN
Power supply reliability indicators
The main reliability indicators are CI and CML.
These indicators have the same meaning as SAIFI
and SAIDI. CI – number of outages per year per
100 consumers (100×SAIFI); CML – average dura-
tion of power outage per year per consumer (SAIDI).
Accountable outages
When regulating reliability, both emergency and
planned outages are taken into account. In this
case, planned outages are taken into account with
a weighting coefficient of 0.5.
When determining the CI indicator, outages due
to violations in adjacent systems are not taken into
account. When calculating the CML indicator, 10%
of outages due to violations in adjacent systems are
taken into account.
When calculating reliability indicators, outages
lasting more than 3 minutes are taken into account.
Outages lasting less than 3 minutes are recorded by
an indicator.
When calculating reliability indicators, outages
caused by abnormal external conditions are not taken
into account. If the daily CI is 8 times higher than the
average daily value for 10 years, then such a day is
classified as a day with abnormal external conditions.
Also, outages due to accidents that disrupted the
power supply to more than 25.000 consumers are not
taken into account.
Determination
of reliability indicators planned values
Target indicators are determined for a long-term
regulatory period (at least 5 years) [7].
For the first year of the long-term regulation
period, CI and CML are determined as the minimum
value of:
– average company CI/CML performance for the
last 3 years;
– he company's CI/CML targets for the last year of
the previous long-term regulatory period.
For the last year of the long-term regulation period,
CI and CML are determined as the minimum value of
the following indicators:
– baseline targets calculated by the regulatory
authority;
– the company's CI/CML targets for the last year of
the previous long-term regulatory period.
If the targets for the first and the last year are
different, then the CI/CML targets for the interim
years change in equal increments each year.
When calculating basic targets, the power
distribution network is divided into groups, targets
are determined for subsystems, and then these
indicators are combined to obtain the entire company
target.
Actual reliability indicators of the power dis-
tribution network are calculated as a basis for
determining the basic target indicators. The methods
for setting targets differ for each subgroup. In some
cases, targets are based on the performance of
individual systems, and in others on the average
performance of all systems in a subgroup. Indicators
are determined based on four years observation to
reduce the effect of random deviations. A longer
interval is not used. Otherwise, the increase in
reliability indicators over recent years would not be
taken into account.
Low voltage (LV) networks (up to 1 kV)
At the low voltage level, grid companies have
little ability to influence the reliability of the power
supply, so the baseline CI and CML are set to the
current values for each company. For companies
with low reliability scores, a target CML of 75% of
the national average has been set.
Medium voltage (MV) networks (1 to 20 kV)
For medium voltage networks, targets are set
based on the following factors:
– average number of power supply disruptions per
1 km of power network;
– average number of consumers disconnected due
to one technological violation, in relation to the
number of the feeder consumers;
– average and first quartile values of the CI/CML
(CAIDI) indicator.
The baseline targets for medium voltage networks
are based on the average performance of all network
companies in one subgroup.
POWER SUPPLY

EP Shanghai 2023
Special issue, November 2023
9
High voltage (EHV) networks (from 20 to 132 kV)
Power networks of this voltage class experience
quite a few outages in one year and their performance
can vary greatly from year to year. In this regard,
targets for this subgroup are calculated based on
the average performance of each company over the
past 10 years. Once targets have been determined
for each subgroup, they are combined and targets are
set for each individual company.
The target for planned outages is defi ned as
a three-year moving average with a two-year lag using
the following expression:
Planned target
year
t
=
(Planned Perf
year
t
–4
+
+ Planned Perf
year
t
–3
+ Planned Perf
year
t
–2
) / 3.
The maximum permissible duration of a consumer
outage is 12 hours.
Grid companies may not be interested in improving
the reliability of power supply to consumers in areas
where outages aff ect a small number of consumers
[5]. This usually applies to sparsely populated rural
areas. In order to stimulate increased reliability of
power supply to these consumers, the regulatory
body introduces the concept of a consumer with low
reliability.
Low reliability customers are those who experience
an average of at least four outages per year over
a three-year period (i.e. 12 or more outages in three
years) [6].
In the UK, a fund has been created to improve
the power supply reliability of consumers with low
reliability. Grid companies receive compensation for
investments in improving power supply reliability of
consumers with low reliability from this fund.
Clustering networks with similar
characteristics
Distribution networks are divided into voltage
groups: LV (up to 1 kV), HV (1 to 20 kV), EHV (20 to
132 kV) and 132 kV. Medium voltage (MV) networks
are then divided into subgroups based on the follow-
ing criteria: percentage of overhead lines, length of
lines, number of connected consumers. Target indi-
cators are calculated separately for each group, and
then combined into a common indicator for the grid
company.
ITALY
Power supply reliability indicators
Targets are set for SAIDI and SAIFI indicators.
Accountable outages
To calculate SAIDI and SAIFI, power supply
interruptions lasting from 3 minutes to 8 hours are
taken into account. Outages not related to disruptions
in the power distribution network or caused by
abnormal weather conditions are not taken into
account when calculating reliability indicators.
MAIFI is used as an indicative value reflecting
the frequency of outages lasting from 1 second to
3 minutes.
Determination
of reliability indicators planned values
Long-term targets are set for all power distribution
networks. The long-term regulation period is 4 years.
The basic values of target indicators are set as
a certain percentile of the indicators for the previous
long-term regulation period.
The baseline SAIDI target for rural and suburban
networks is defi ned as the 10% percentile, for urban
networks – as the 30% percentile of SAIDI values for the
previous long-term regulatory period. SAIFI's baseline
targets correspond to the 20 and 30% percentiles.
At the beginning of the long-term regulatory pe ri-
od, each distribution company sets its own reliability
targets for each year. These indicators are determined
based on data for the network company for the previous
two years and basic target indicators.
To distribute target indicators by years, the im-
prove ment rate coeffi cient is used. It is calculated as
follows:
– for SAIDI to achieve the baseline target within
8 years, but not less than 2%;
– for SAIFI to achieve the baseline target within
12 years, but not more than 6%.
Feeders with reliability scores 1.5 times worse
than the baseline targets are classified as low
performing power networks. First of all, network
companies are en couraged to improve the reliability
of such networks [8].
Clustering networks with similar
characteristics
Networks are combined into three groups
depending on load density: rural, suburban and urban.
NETHERLANDS
Power supply reliability indicators
The reliability of power transmission is cha rac-
terized by the SAIFI and CAIDI indicators. Reported
reliability indicators are calculated for outages
only. The values obtained for planned outages are
indicative.
Accountable outages
When calculating reliability indicators, almost all
violations are taken into account, including those
that the distribution company can’t directly influence,
for example, cable damage during excavation work
by a third party. Only exceptional events, such as
terrorist attacks, are considered as force majeure
events, when outages are not taken into account in
reliability indicators.
Determination
of reliability indicators planned values
Planned reliability indicators are not explicitly
established. The Netherlands uses a ranking system
for network companies based on a general indicator
of reliability and quality of services provided. The
size of the permissible established tariff depends on
the rating of the network company.

10
Based on the SAIFI and CAIDI indicators, da-
mage from unreliable power supply is determined.
It is taken into account when calculating the general
indicator.
The generalized indicator is calculated for a 3-year
regulation period. The calculation uses the SAIFI
and CAIDI indicators of network companies for the
previous regulatory period, as well as the average
SAIFI and CAIDI values for all network companies for
the same period.
According to Dutch law, network companies must
pay compensation to all customers for interruptions
that last more than 4 hours.
Clustering networks
with similar characteristics
All distribution networks in the Netherlands have
similar characteristics and operate under similar
conditions, so no additional clustering is applied. Av-
erage values of reliability indicators are determined
for all power distribution networks in the country.
USA. NEW YORK
In the United States, power distribution companies
are regulated at the state level.
Power supply reliability indicators
SAIFI and CAIDI are the main reliability indicators.
Network companies submit annual reports containing
accident rate analysis in their operating areas,
reliability improvement projects and analysis of the
worst-performing electricity feeders state.
Accounted outages
The outages frequency and duration are
standardized for normal operating conditions. In this
case, outages under abnormal external influences
are not taken into account. Moreover, the indicators
are also calculated taking into account all outages
used as indicative ones.
Abnormal external events are considered to
be those where power supply to at least 10% of
consumers in the operating area is disrupted and/or
the outage duration exceeds 24 hours.
Determination
of reliability indicators planned values
Two mechanisms are used to regulate the
reliability of power distribution networks: baseline
targets setting and tariff regulation [9].
The regulating authority collects detailed informa-
tion on technological disturbances in all networks ev-
ery month and it determines annual reliability indica-
tors for each operating area. On the basis of actual
data on the electric power system reliability, baseline
reliability targets are established for each operating
area. These indicators correspond to the acceptable
minimum level of reliability and they are used to as-
sess the actual level of electric power system reliabil-
ity; however, they are not used to determine penalties
or bonuses for network companies.
Tariff regulation is applied in relation to reliabil-
ity targets established for the network company as
a whole.
Clustering networks
with similar characteristics
Reliability indicators are determined for operating
areas. Operating areas correspond to the territorial
division and they include network sections with simi-
lar parameters.
USA. CALIFORNIA
Power supply reliability indicators
Network companies submit an annual reliability
report, that includes:
– SAIDI, SAIFI and MAIFI both at the level of the
entire network company and at the most detailed
level possible;
– information on the worst-performing electricity
feeders;
– external events and activities that have had an
impact on reliability;
– information on the current state of the equipment,
maintenance and repair activities.
Accounted outages
Reliability indicators are determined without
taking into account outages caused by abnormal
external events. According to IEEE Std 1366-2012 [1]
the "2.5 beta" method is used to determine abnormal
events.
Determination
of reliability indicators planned values
The maximum duration of power supply interruption
for an individual consumer is 24 hours.
Prior to 2006, the Reliability Incentive Mechanism
(RIM) was in force. It was aimed at tariff incentives to
achieve annual reliability targets. In the Brattle Group
report [9] there is note that the key disadvantage
of this approach is the short-term measures
incentivization. The incentivization effect could
come out in the next year. Long-term investments
are supported to a much lesser extent under this
approach. In 2006, the Reliability Investment
Incentive Mechanism (RIIM) was adopted. It was
aimed at long-term effectiveness. Defined level
of investment in the distribution network reliability
growth was established, especially in terms of
network modernization, preventive maintenance
and equipment replacement. If a network company
fails to ensure the required level of investment
in reliability growth, the accepted tariff level is
reduced.
The regulating authority continues to collect de-
tailed annual reports on the electric power system
reliability despite the lack of specific reliability tar-
gets. The standard in force until 2006 set reliability
targets for network companies. The SAIDI targets
ranged from 52 to 157 minutes per year, SAIFI –
from 0.9 to 1.24 failures per year.
POWER SUPPLY
EP Shanghai 2023
Special issue, November 2023
11
RESULTS FROM THE ANALYSIS OF
DOMESTIC AND FOREIGN EXPERIENCE
IN RELIABILITY RATIONING
Established on legislative level, the minimum duration
of power outages level varies across countries:
– over the time of automatic power restoration
(Russia);
– 3 minutes (Great Britain, Italy);
– 5 minutes (USA, California).
Formal criteria for excluding power outages under
abnormal external conditions are defined in Great
Britain, Italy, the USA (New York, California). In the
Netherlands power outages under abnormal external
conditions are taking into consideration. In Russia,
a grid operator is always responsible for power
outages while formal criteria for determining such
power outages are not formalized by regulations.
Scheduled power outages in the calculation of main
reliability indicators in Russia are accounted separately
by indicative fi gures
SAIDI,rep
,
SAIFI,rep
. In the UK, plan-
ned outages are taken into account in the calculation
of basic reliability indicators with a weighting factor
of 0.5. In Italy, the Netherlands, the USA (New York,
California) planned power outages are not taken into
account in the calculation of main reliability indicators.
The main reliability indicators in the reviewed countries
are SAIFI and SAIDI or their analogs.
Planned reliability indicators for power distribution
networks are set separately for each grid operator. At
the same time, as a rule, the methodology for calculating
these standards is established at the legislative level.
In Russia, the target values are reference values
adjusted to the current year taking into account the
rate of improvement. Reference values for each group
are determined as average values within the group for
the previous three years. In the UK, target values are
determined in a diff erent way for various groups based on
retrospective data. Then they are combined into a single
indicator for the grid operator. In Italy, target values are
set as a certain percentile of the values for the previous
long-term regulatory period. In the Netherlands and the
United States (California), targets are not defi ned and
grid operators are ranked by actual values. In the USA
(New York), the planned reliability indicators correspond
to the minimum acceptable level of power network
reliability while tariff regulation is based on the planned
reliability indicators for grid operators. For the countries
considered, the plan indicators are set for each type of
power network separately based on retrospective data
for the previous 3-5 years.
The reliability of different power distribution
networks can vary quite significant. Many countries
divide power networks into types depending on
operated territory, climatic conditions, load density
and other factors.
Target values set in Russia are in line with those
in other countries. The scatter of SAIDI and SAIFI
target values for different groups of power networks
depending on operated territory, climatic conditions,
load density and other factors for the aforementioned
countries is shown in Figure 1. For Moscow and the
Moscow Region, these indicators are characterized
by very high reliability of the distribution networks.
In general, the regulatory framework for reliability
rationing in Russia is in line with global trends and
regulatory approaches.
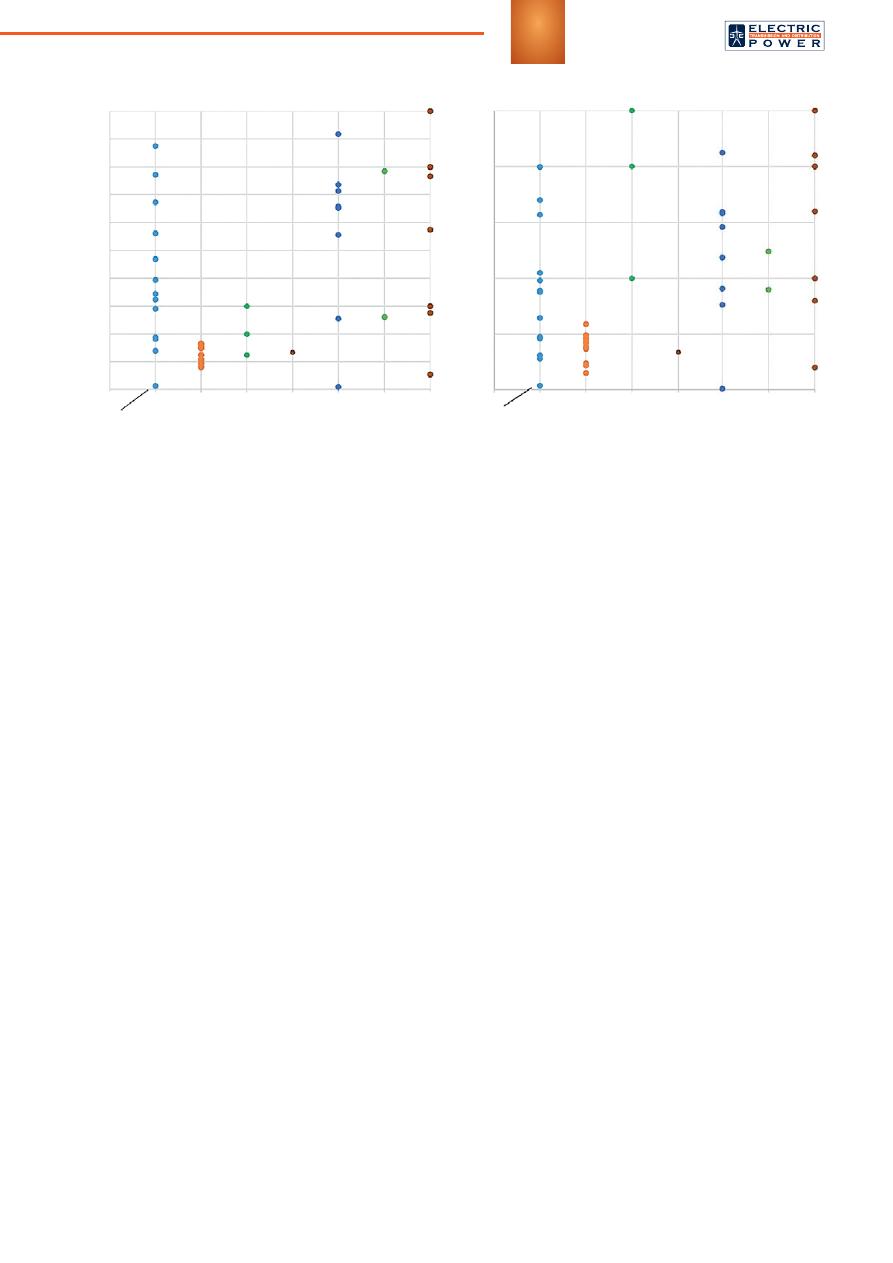
Fig. 1 – Scatter of reliability indicators SAIDI, SAIFI planned values. Source: [5–11]
Planned values SAIDI, min/year
Planned values SAIFI, 1/year
200.0
180.0
160.0
140.0
120.0
100.0
80.0
60.0
40.0
20.0
0.0
2.5
2
1.5
1
0.5
0
Moscow
Moscow
Russia (Rosseti Group)
Russia (Rosseti Group)
Great Britain
Great Britain
Italy
Italy
Netherlands
Netherlands
U
S
A
. New
Y
ork
U
S
A
. New
Y
ork
U
S
A
. California
U
S
A
. California
Australia
Australia
480; 964
4; 7.4
4

12
POWER SUPPLY
REFERENCES
1. IEEE Std 1366-2012 (Revision of IEEE Std 1366-
2003). IEEE Guide for Electric Power Distribution
Reliability Indices. URL: https://standards.ieee. org/
ieee/1366/4602/.
2. Order of the Ministry of Energy of the Russian Federation
No. 1256 dated November 29, 2016 "On Approval of the
Methodological Guidelines for Calculating the Reliability
Level and Quality of Supplied Goods and Services for the
Organization for Management of the Unifi ed National (All-
Russian) Power Grid and Territorial Grid Organizations".
URL: https:// base.garant.ru/71578114/.
3. Resolution of the Government of the Russian Federation
No. 1178 dated December 29, 2011 (as amended on
February 17, 2022, rev. March 29, 2022) "On pricing in
the fi eld of regulated prices (tariff s) in the electric power
industry" (with "Fundamentals of pricing in the fi eld of
regulated prices (tariff s) in the electric power industry",
"Rules of state regulation (revision, application) of prices
(tariff s) in the electric power industry"). URL: https://sudact.
ru/law/postanovlenie-pravitelstva-rfot-29122011-n-1178/.
4. Order of the Ministry of Energy of the Russian Federation
No. 976 dated October 28, 2017 "On Approval of Basic
Values of Reliability Indicators, Values of Coeffi cients
of Permissible Deviations of Actual Values of Reliability
Indicators from Target Values and Maximum Dynamics
of Improvement of Planned Reliability Indicators for
Groups of Territorial Grid Organizations with Comparable
Economic and Technical Characteristics and (or)
Operating Conditions with Application of the Method of
Comparing Analogues". URL: https://www.garant.ru/
products/ipo/prime/doc/ 71709300/.
5. Strategy decision for the RIIO-ED1 electricity distribution
price control. Reliability and Safety. URL: https://
www.ofgem.gov.uk/sites/default/files/docs/2013/02/
riioed1decreliabilitysafety.pdf.
6. Statutory security of supply report. Department for
Business, Energy & Industrial Strategy, UK Government,
2018, HC 1644 doc. no., p. 6. URL: https://www.gov.uk/
government/publications/statutory-security-of-supply-
report-2021.
7. RIIO-ED2 Methodology Decision: Annex 1 – Delivering
value for money services for consumers. URL: https://
www.ofgem.gov.uk/sites/ default/fi les/docs/2020/12/
riio_ed2_ ssmd_annex_1_delivering_value_for_money_
services_for_customers. pdf.
8. Approaches to setting electric distribution reliability
standards and outcomes. The Brattle Group, Ltd., 2012.
191 p.
9. Order Adopting Standards on Reliability and Quality of
Electric Service. Case 90-E-1119. June 26, 1991.
10. Order of the Department of Economic Policy and De-
velopment of Moscow No. 466-TP dated November 28,
2022 "On Setting Long-Term Regulatory Parameters and
Required Gross Revenue for 2023-2027 for Public Joint
Stock Company Rosseti Moscow Region, where the
tariff s for electric power transmission services are set".
URL: https://docs.cntd.ru/document/ 1300059143.
11. Order of Committee on Prices and Tariff s of the Moscow
Region No. 221-P dated November 25, 2022 "On setting
individual tariff s for electric power transmission services
for mutual settlements between PJSC Rosseti Moscow
Region and territorial grid organizations in the Moscow
Region". URL: https:// base.garant.ru/405862041/.
In accordance with the current Russian legislation,
all power engineering entities should strive to reduce the
number of electrical equipment outages and improve
the reliability of power supply to consumers.
Improving reliability requires an increase in the
volume of investments in electric power facilities
because the creation of margin power and reserve
schemes is essential. After all, it leads to an increase in
tariff s. In this regard, it is advisable to achieve an optimal
reliability level with relation to both power consumers
and electric power industry entities. The optimal
reliability level from the viewpoint of power consumers
is determined by the balance between the number and
duration of electric power supply interruptions that do
not create discomfort for consumers and do not aff ect
the level of tariff s that consumers are willing to pay. The
optimal reliability level for power engineering entities
is determined by the balance between investments in
improving the level of reliability and compensation for
unreliable power supply.
Currently, there is a signifi cant drawback in the
Russian regulatory framework concerning the issues
of establishing target values of reliability indicators. The
current methodology [2] provides an annual decrease
in reliability indicators (improvement of reliability level)
by at least 1.5% while the unreduced reliability level is
not determined. In fact, this level should be maintained
without requirements for improvement.
It is worth mentioning that the means of objective
control in 20 kV and below distribution networks are
rather poorly developed. As a result, observability
absence of these networks takes place. The need to
provide regular and, as a rule, unjustifi ed accident rate
reduction leads to systematic corruption of accident rate
data in order to meet the established reliability indicators.
As a result, the true picture of the current accident
rate situation and especially the causes of accidents is
very often corrupted. Timely measures to correct the
situation and ensure the required reliability level for
consumers seems not possible.
Taking into account the aforementioned data and
the analysis performed, it is necessary to establish both
reliability dynamic indicators and targets to be provided
by grid companies. The calculation of these indicators
should include objective parameters of the grid company
functioning.
CONCLUSIONS
The paper analyzes domestic and foreign experience in
rationing the reliability of distribution networks in Russia,
Great Britain, Italy, the Netherlands and the United States
(California and New York). According to the results of
the analysis, the regulatory framework for reliability
rationing in Russia correspondes to global trends and
approaches to reliability regulation in other countries.
Moscow and the Moscow Region are characterized by
very high reliability relative to the target indicators in
other countries. The issue requiring further elaboration
is the defi nition of reliability indicators target values
in the conditions of current operation and selection of
criteria for their assessment.
Оригинал статьи: Аnalysis of Domestic and Foreign Experience in Rationing the Reliability of Power Distribution Networks
The paper analyzes domestic and foreign experience and compares the different countries approaches to rationing the power distribution networks reliability. The main indicators of power supply reliability in different countries with respect to outages, approaches for planned values determination and clustering of networks with similar characteristics are considered. Understanding the basic principles of power distribution network reliability regulation applied in foreign countries allows specialists to identify best practices and adapt them to domestic conditions.